Statistical Analysis: Exploratory Data Visualization on Traffic Crashes

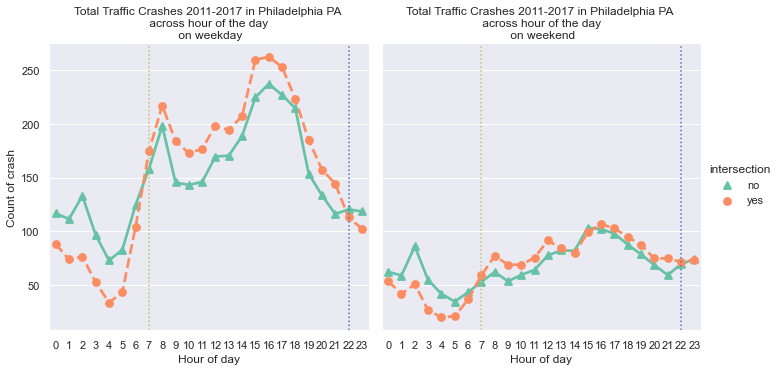
I used matplotlib, seaborn, and altair libraries to explore Philadelphia’s traffic crashes data. For each chart and library, I discussed why I picked the specific library, the motivation behind the visualization, and some preliminary findings.
disclamer: this project is a part of a graduate course