Spatial Analysis: Bus Ridership Analysis and Prediction
As a group of three, we hope to gain a better understanding of the bus ridership service and usage, and apply our insights to improve planning of bus stations. With Chicago’s data, we explored boarding and alighting patterns across geographies and sociodemographics to select indicators of ridership demand. From there, we built a prediction model to help predict ridership demand and demonstrate a use case on another city without ridership information. For our project we selected Philadelphia. Finally, we visualized a dashboard to help city officials identify areas in need of better bus services.
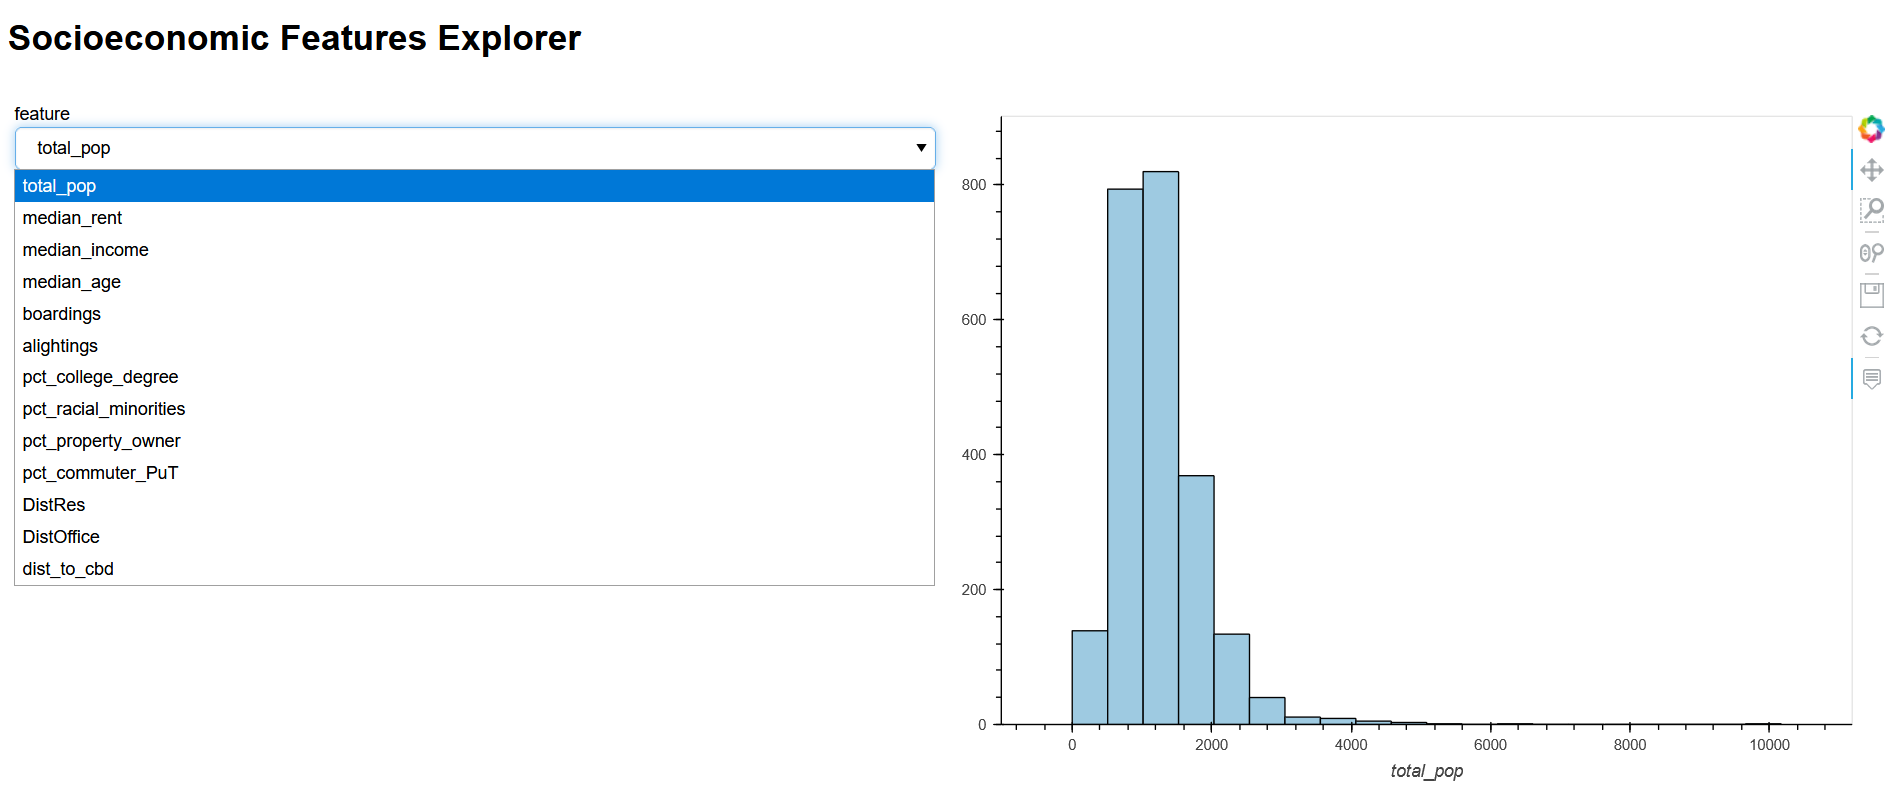
Dashboard 1: Explorer of Socioeconomic Features (Chicago)
This link leads to the binder app for the histogram distribution of selected socioeconomic variables. Users can select variables from the dropdown box on the left. The plot on the right will help visualize the distribution of variables, which further could use to determine if data transformation is necessary.
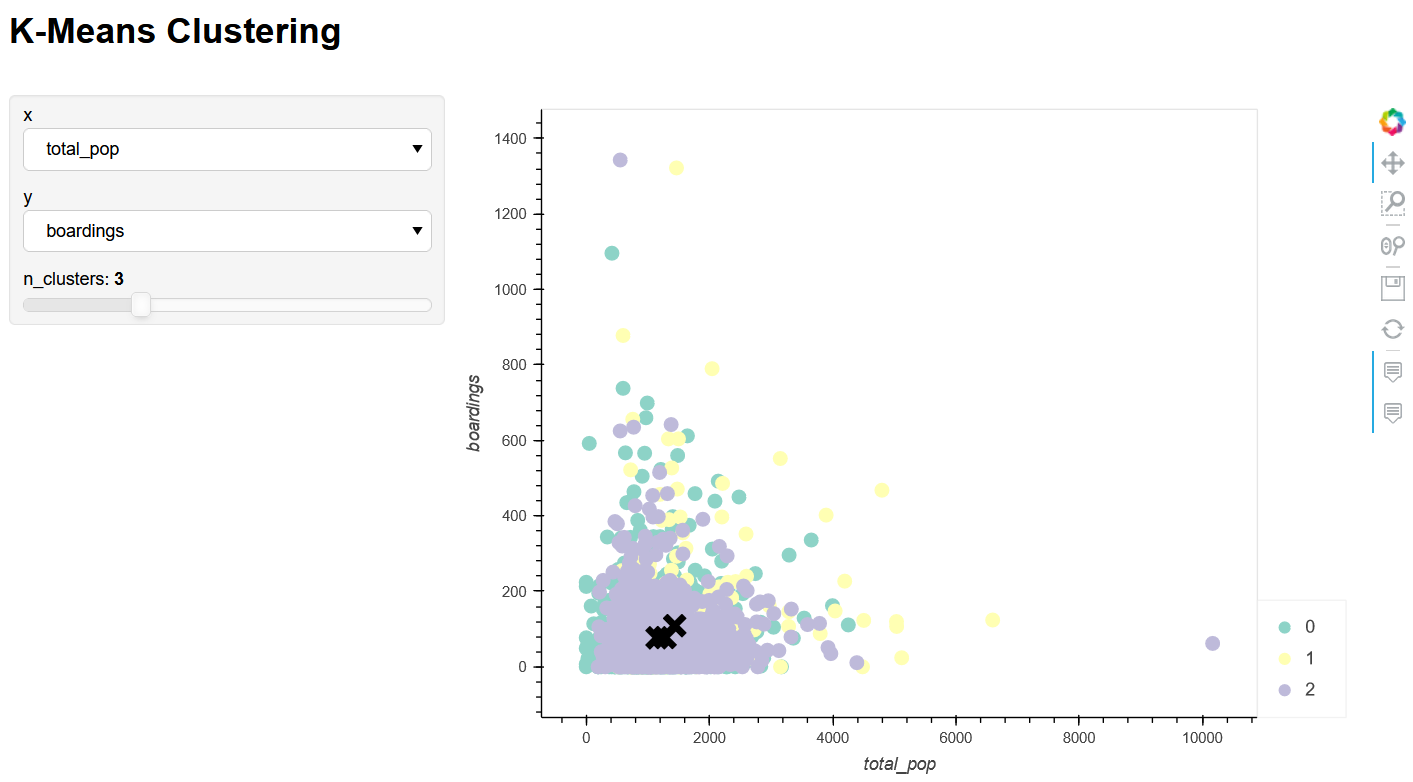
Dashboard 2: Clustering Analysis (Chicago)
This link leads to the binder app for the K-Means Clustering dashboard. On this dashboard page, users can adjust the x and y variables to see the scatterplot for selected variables.
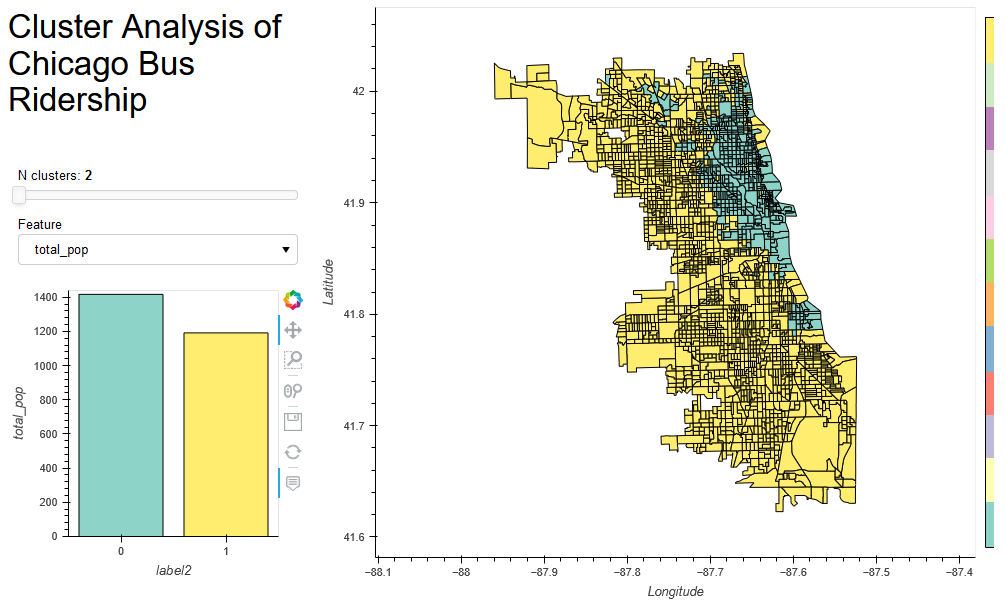
On this dashboard page, users are able to adjust the number of clusters (2-8) and observe the geographic distribution of the clusters. While the histogram shows the mean value of each clusters, the map on the right shows the spatial distribution of the clusters.
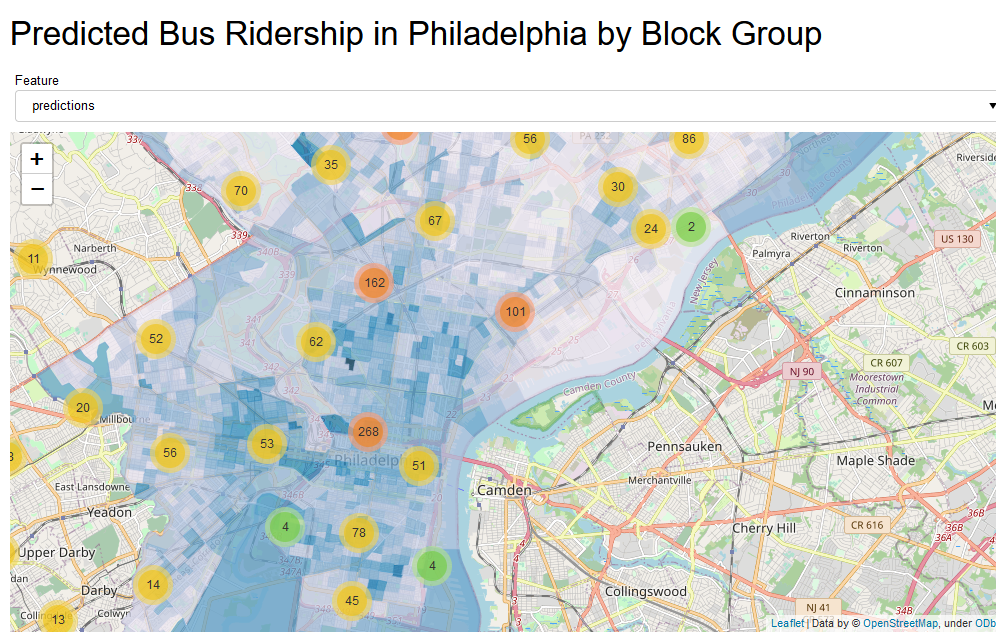
Dashboard 3: Ridership Demand and Stops (Philadelphia)
This binder app shows our predicted bus ridership at block groups level for Philadelphia. Users are able to see the number of stops in an area with predicted ridership or other socioeconomics variables.
To see the python script, please click on “View Analysis” or “View Project”.
disclamer: this project is a part of a graduate course